
Free Stock Finding Tools. Identify interesting stocks or Exchange Traded Funds.
StockValueFinder.com is set of free research tools built for investors who want more than hype, headlines, newsletters, or random stock tips. The data here is identified 100% by its performance. We only look at the numbers and there is no bias.
Instead of guessing which companies might be worth researching, Stock Value Finder uses a disciplined screening system to search through thousands of publicly traded stocks, Exchange Traded Funds and identifies companies that meet strict long-term investing criteria.
Website Tools:
Tool #1 – Stock Value Finder’s Winning Companies. We searched through over 6,000 different stock tickers looking for companies with specific key metrics. What we looked for: #1 Positive Earnings Per Share for at least 6 straight months. #2 ROIC (Return of invested capital), 10% or higher required. #3 Interest Coverage Ratio of 6 or greater. #4 Debt payback time in 3 years or less. #5 P/E Ratio’s of under 15, not ones that are overly inflated. (Watch this video that explains it!)
Tool #2 – Buy on the Dip. Enter in a ticker symbol. It will go out and find previous dips on that stock or ETF and give you suggestions when to do a LIMIT BUY on whatever brokerage that you use to purchase stocks or Exchange Traded Funds.
Tool #3 – Stock Analysis. Enter in a ticker and we will identify it’s ROIC, Earning Per Share, Internet Coverage Ratio, Debt Payback and P/E Ratio and give a scoring system. Our 18-Agent Hedge Fund review board votes positive, negative or neutral on the stock. Each agent votes differently and goes strictly by the raw data about the stock and votes independently on it. Similar if you asked an opinion of Warren Buffet, Peter Lynch or “Mad Money’s” Jim Kramer and get their thumbs up or thumbs down to buy the security or pass up on the opportunity.
Tool #4 – Stock Research. We wrote articles on many of the funds that have shown up on the website so you can read more about why they were chosen.
Tool #5 – Almost Winners. These particular stocks didn’t score 100% the same way our stock winners did. Based on performance data, we didn’t want to rule them out, so we also made a separate page for them for you to research. Based on their performance, we believe that many of these companies could be good to hold for the long term.
Tool #6 – Dividend Payers. Search various companies that pay dividends. We will show you their current dividend yield and explain by example of how much you could earn in dividends with only $1,000 invested.
Tool #7 – NAV Erosion Test. Avoid investing in Exchange Traded Funds that have NAV Erosion (Net Asset Value). For example, you probably don’t want to invest in an ETF that was worth $112/share just 12 months ago and today is only worth $5 to 13. Use this tool just to run a quick test to be sure.
Tool #8 – Swing Trading. We actively check through thousands of stocks trying to identify a Swing Trade for bullish opportunities. These opportunities come and go. We try to identify the pattern and display them on this page if we think we found it. These are very rare and require a lot of time to research. To see how we look for Swing Trade opportunity, download this free eBook that explains more on how Swing Trading works.
Tool #9 – ETF Income Generator. This amazing tool is able to give you an exact blue print to achieving a monthly income by receiving dividends. You simply enter in how much you’d like to earn per month and it will go out and display the highest dividend-paying ETF’s that will accomplish this goal. In order to achieve the monthly income you’d like to earn, it will quickly show you examples of ETF’s that you can buy on your own brokerage account, how many shares to buy of that ETF and even what are some prices you could pay using a Limit-Buy option so that you don’t over-pay. Sure, there are many ETF’s capable of paying 80 to 100% or higher yields. But most of those ETF’s have severe NAV erosion. Our system goes back 12 months on each ETF and check to see if there is a severe decline in price over the last 12 months. In the event that you don’t want to risk buying newer ETF’s that recerntly came out that have no track record yet, we also have filters to hide those as well. All of this gives you the best bang for the buck. There are different options to set how aggressive or diversified the ETF’s are to be displayed.
Tool #10 – Dividend Calendar Calculator. Type in all of the tickers of Stocks/ETFs and number of shares that you are holding for each security. Click the TAB key to enter in the next stock or ETF, limited to 50 securities per portfolio. We will look up recent prices and dividends for your holdings. Once you enter in your portfolio, we can build a dividend calendar forecasting approximate dividend payments you can receive from that security and display the Stock or ETF’s fund performance data. You will get an idea of how much you could expect to earn on any given day of the week. For example, if you were to own 100 shares of AAPL, you could expect to receive approximately $9 per month average. This time saving tool quickly forecasts payments, saving you tons of time of creating your own spreadsheets and doing manual calculations. All portfolios entered in on this calculator are saved on your local browser only. We do not save any of your information. We do not store any personal data.
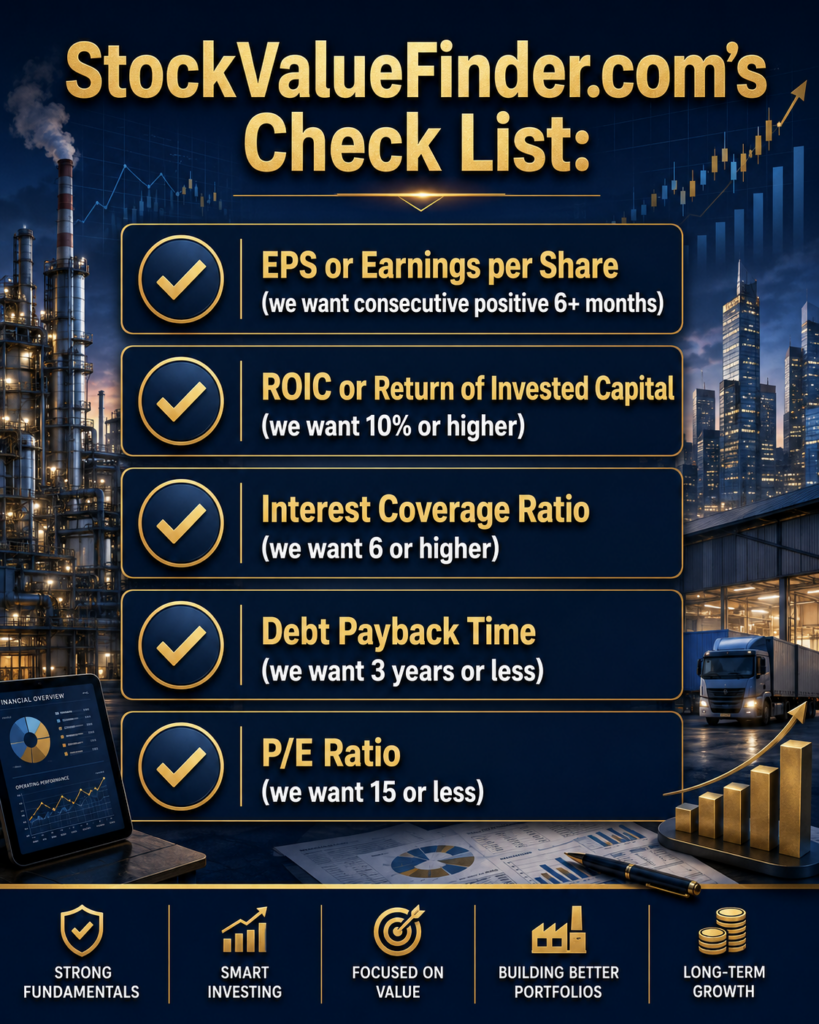
We had to painfully go through over 5,000 stocks, one at a time, to find the very few in the stock universe that met this very strict criteria.
The goal is simple:
Find financially strong companies, avoid weak balance sheets, and help investors discover quality stocks before doing deeper research.
A Smarter Way to Search for Long-Term Stock Ideas
Most investors do not have time to manually research thousands of companies.
To properly compare stocks, you would need to check earnings, profitability, debt strength, valuation, free cash flow, interest coverage, price trends, and long-term performance. Doing that one company at a time is slow, frustrating, and almost impossible for the average person.
Stock Value Finder helps automate that first step.
The system scans stocks using important long-term investing metrics such as:
- Earnings per share strength
- Return on invested capital
- Interest coverage
- Debt payback ability
- Price-to-earnings valuation
- Free cash flow strength
- Moving average trend signals
- Long-term price history
This helps separate stronger companies from weaker ones and creates a focused research list instead of a pile of random ticker symbols.
Built Around Long-Term Investing Principles
Stock Value Finder is not designed to chase meme stocks, penny-stock pumps, or short-term flips.
The system is designed to help identify companies that may be better suited for long-term investors looking for financial strength, reasonable valuation, and durable business performance.
A stock that earns a high score is not an automatic buy. It is a signal that the company may deserve closer research.
The system is meant to help answer questions like:
- Is this company profitable?
- Is the company producing strong returns?
- Can the business handle its debt?
- Is the valuation reasonable?
- Is the stock currently in a strong or weak price trend?
- Is this a company worth adding to a serious watchlist?
Find the Diamonds Hidden in Thousands of Stocks
The best opportunities are rarely obvious.
Strong companies are often buried inside huge lists of tickers. Without a systematic screening tool, finding them can feel like searching for a needle in a haystack.
Stock Value Finder performs the brute-force research work by scanning large groups of stocks and highlighting the few companies that pass strict financial tests.
Instead of relying on opinion, hype, or someone else’s newsletter, you can start with data.
Quality Score + Entry Timing
Finding a strong company is only the first step.
Buying at the wrong time can still lead to poor short-term results, even when the company is excellent. That is why Stock Value Finder also looks at moving average trends and price behavior.
The goal is to separate two different decisions:
Company Quality: Is this a strong business worth researching?
Entry Timing: Is the stock currently extended, fairly priced, pulling back, or showing a stronger buy setup?
This helps investors avoid chasing stocks after a big run and instead focus on building a watchlist of strong companies that may become attractive when the timing improves.
What Stock Value Finder Is Designed To Do
Stock Value Finder helps investors:
- Screen thousands of stocks faster
- Identify high-quality companies
- Build a long-term watchlist
- Compare important financial metrics
- Avoid companies with weak debt coverage
- Spot stocks with attractive valuation metrics
- Monitor strong companies for better entry points
- Focus research time on better candidates
Important Reminder
Stock Value Finder is a research tool, not financial advice.
No screening system can guarantee future returns. Even strong companies can fall during recessions, market crashes, industry downturns, or company-specific problems.
A high score means a stock may be worth deeper research. Investors should always review the company’s filings, business model, risks, industry outlook, valuation, and personal investment goals before buying any stock.
Start Finding Better Stock Candidates
Stock Value Finder helps turn thousands of stocks into a focused list of stronger long-term candidates.
Use the screener to discover companies worth researching, build your watchlist, and wait for better entry opportunities.
Find value. Invest smarter. Build wealth.
Latest Research From Winning Stocks
Educational stock research articles based on StockValueFinder screening data, valuation metrics, financial strength checks, and trend signals.
AMP Stock Analysis: Why Ameriprise Financial Inc Scored 93% in Stock Value Finder
Educational Analysis of Ameriprise Financial Inc (AMP) This article provides an educational review of Ameriprise Financial Inc (AMP), a prominent […]
ACGLO Stock Analysis: Why Arch Capital Group Ltd Scored 90% in Stock Value Finder
Educational Stock Research Analysis: Arch Capital Group Ltd (ACGLO) This article provides an educational review of Arch Capital Group Ltd […]
GIB Stock Analysis: Why CGI Inc Scored 90% in Stock Value Finder
Educational Stock Research Analysis: CGI Inc (GIB) This comprehensive research report provides an educational overview of CGI Inc (GIB), a […]
HBM Stock Analysis: Why Hudbay Minerals Inc. Scored 93% in Stock Value Finder
Educational Stock Research Analysis: Hudbay Minerals Inc. (HBM) This article provides an educational review of Hudbay Minerals Inc. (HBM) using […]
HRB Stock Analysis: Why H&R Block Inc Scored 90% in Stock Value Finder
Educational Stock Research Analysis: H&R Block Inc (HRB) This article provides an educational review of H&R Block Inc (HRB) using […]
TDC Stock Analysis: Why Teradata Corp Scored 97% in Stock Value Finder
Educational Stock Research Analysis: Teradata Corp (TDC) This article provides an educational review of Teradata Corp (TDC) based on data […]